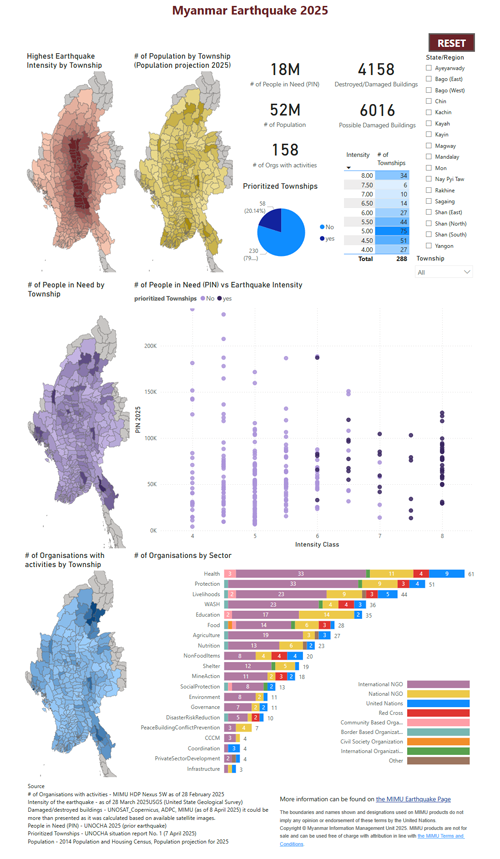
The latest dashboard from MIMU aims to provide detailed insights into the humanitarian impact and to support response efforts following the earthquake. This interactive dashboard features:
- Township-level maps highlighting earthquake intensity, population distribution, and existing activities based on HDP Nexus 5W data. It also features 58 most-affected townships.
- Key figures, including the number of destroyed and damaged buildings based on satellite imagery.
- Presence and sectoral distribution of agencies active prior to the earthquake, based on HDP Nexus 5W data.