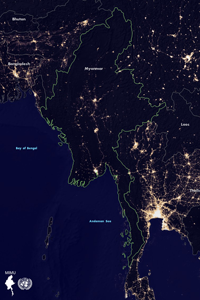
Myanmar by Night 1992-2022
30 Years at a glance
Night-Time Satellite images are built from photographs of the earth taken from satellites over the course of the calendar year. Many studies have taken advantage of extensive historical data to monitor artificial lights from space and study relationships between human activity and socio-economic activities, electricity consumption, light pollution, gas flares, fishing boats and urban extent mapping.
MIMU has compiled Night-Time Satellite images of Myanmar and neighbouring countries over the period 1992 to 2022 as captured by two satellites:
- The Defense Meteorological Satellite Program - Operational Linescan System (DMSP – OLS) of the US Air Force Space and Missile Systems Center (SMC) - began in 1992 and continues to this day.
- The Visible Infrared Imaging Radiometer Suite Day/Night Band (VIIRS – DNB) has been operational since 2012 through a joint partnership between NASA and National Oceanic and Atmospheric Administration (NOAA).
Nightlights Videos
Nightlights Map
Nightlights Publications
- Shedding Light on Myanmar's Development Challenges through Night-time Light (Aug 2024)
The analysis of nighttime light (NTL) satellite imagery can provide a comprehensive and nuanced understanding of Myanmar’s development trajectory and ongoing challenges, particularly post-2021. NTL data has proven to be an invaluable tool in highlighting the intricate interplay between economic activities, urbanization, and socio-economic conditions. The significant decline in NTL intensity post-2021 at all administrative levels and categories corroborates the severe economic downturn and regression in both urban and rural development. The NTL decline is also reflective of reduced access to affordable and reliable electricity, exacerbating socio-economic inequalities and human well-being, especially in conflict-affected areas. - Economic Development in Myanmar’s Border Regions: Evidence from Nightlights - 18 September 2020
The evolution of nightlights in Myanmar’s border regions over the period 2013-2019 suggests increased incomes in urban areas bordering China and Thailand, but not in the rural areas between these towns or off the main road networks leading to the border towns. Regions bordering India saw a reduction in nightlight intensity in this period. Light growth on the neighbouring country side remained greater than on the Myanmar side, suggesting Myanmar border-region populations may not be benefiting fully from the opportunities offered by liberalized cross-border trade in this period. - Electrification in Myanmar in 2012-2018 using nightlight satellite data - 11 December 2019
Between 2012 and 2018, total electricity consumption in Myanmar has increased mainly in the area served by the central grid, whereas areas not served by centralised grids and high-elevation areas are lagging behind in electricity access. In 2018, the average electricity consumption per capita in areas served by the grid was 543 kWh/person and in off-grid areas 68 kWh/person. Even so, 41% of the population in the grid area and 87 % in the off-grid area were found to be living in areas under energy poverty (<120 kWh/person). Some off-grid areas in Tanintharyi, northern Kachin/Sagaing and Northern/Eastern Shan State were found to have some of the highest per capita rates of electricity consumption in the country. Analysis developed by Amperes