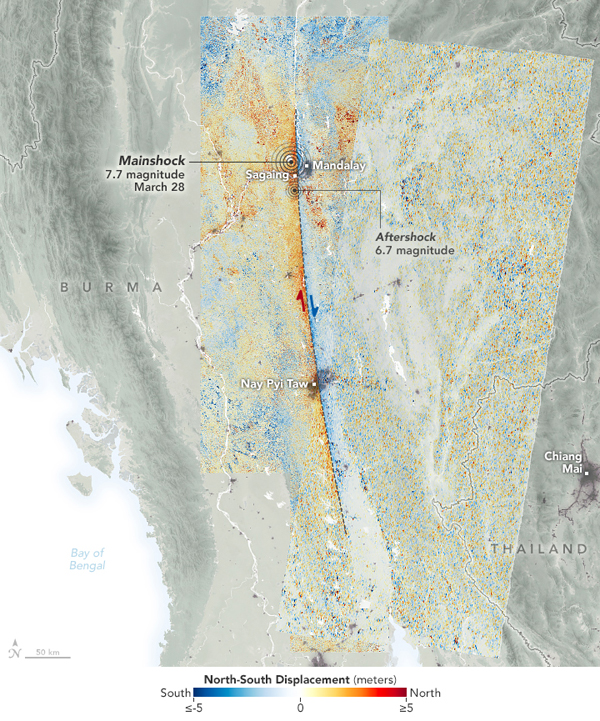
NASA JPL teams used radar and optical images from ESA’s Sentinel 1 and Sentinel 2 satellites into a map of how the land displaced during the 28 March Mw 7.7 earthquake and its Mw 6.7 aftershock. Pixels west of the Sagaing Fault slid north (red); pixels to the east slid south (blue), exposing over 3 metres of motion on each side—more than 6 metres of total offset in some places.