News

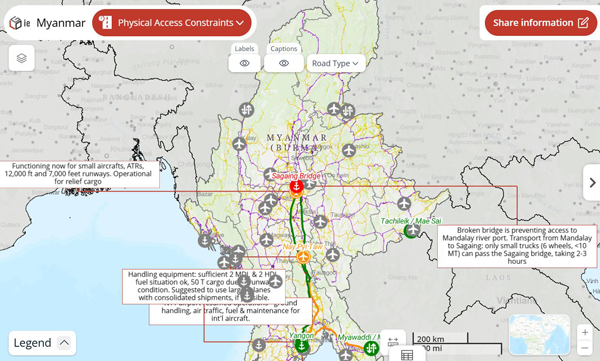
Timely logistics information is important during disasters, and to meet this critical need, the Logistics Cluster has released an interactive map focused on the latest situation in Myanmar.

This will provide updates on:

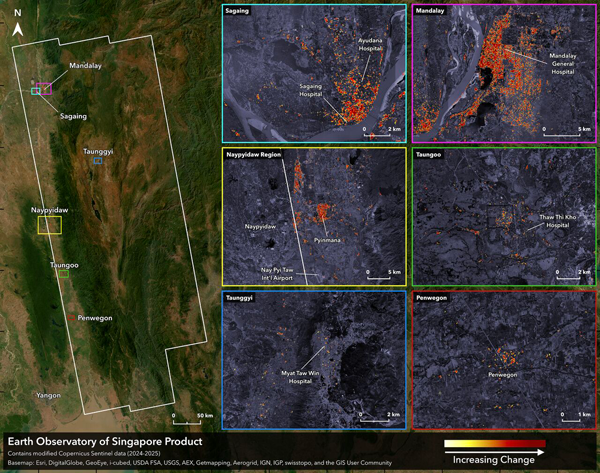
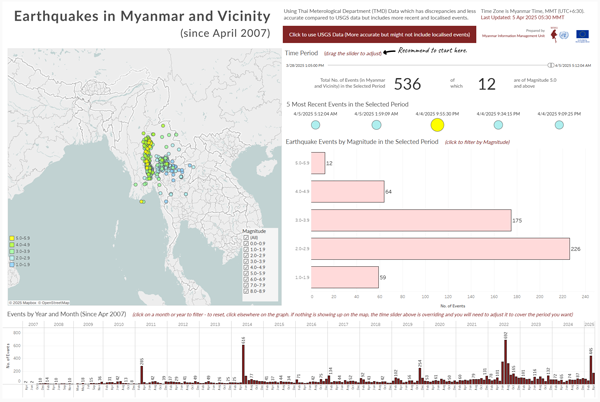
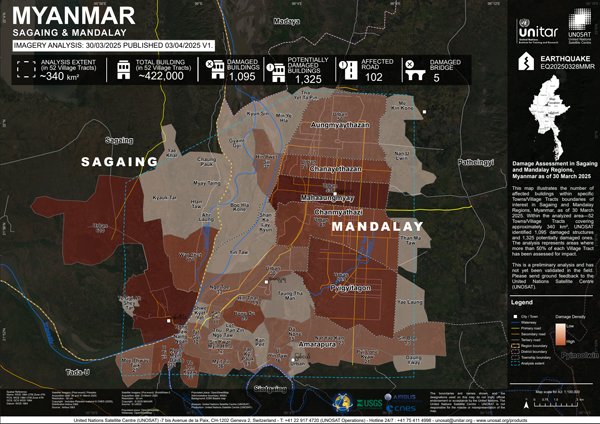
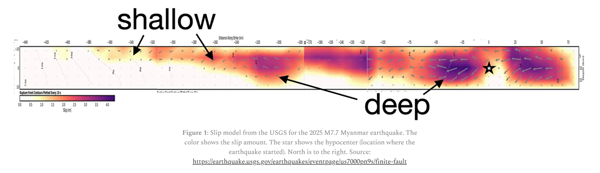
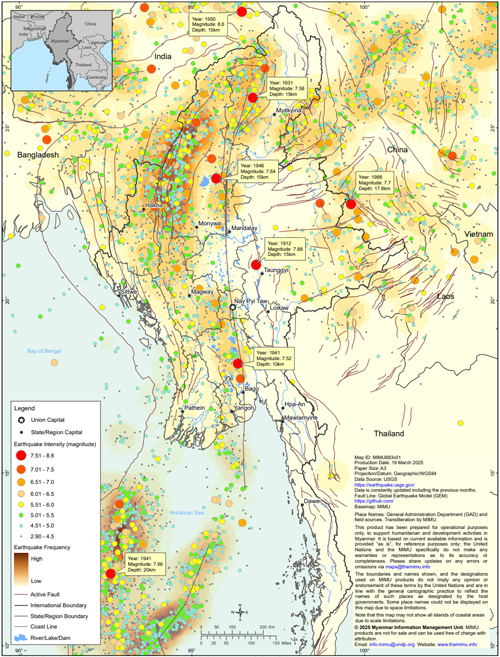
  • Situation Monitoring: Offering current updates on emergency situations, including floods, cyclone paths, earthquakes, and damage assessments.
  • Physical Access Constraints: Providing details on the condition of roads, rivers, and bridges impacted by damage, flooding, or landslides.
  • Waste Management & Recycling: Presenting an overview of waste management facilities, recycling capabilities, and best practices, mapped by the WREC project.

Read the latest situation report from Logistics Cluster.

Earth Observatory of Singapore (EOS) recently released a comprehensive Damage Proxy Map (DPM) covering approximately 158,000 square kilometres, including Mandalay and many other cities and small towns in Myanmar near the fault rupture that caused the Mw7.7 earthquakes on 28 Mar 2025. The map was derived from SAR data acquired on 3 Apr 6:09 PM local time from the Copernicus Sentinel-1 satellites operated by the European Space Agency (ESA). The figure below shows an illustrative image of the map, and the map can be downloaded from this webpage (filenames: EOS-RS_20250403_DPM_S1_Myanmar_Earthquakes_v0.9.kmz and .tif)

The KMZ file is very light and portable (25 KB), making it useful for viewing the maps in the Google Earth app on mobile devices used by on-the-ground teams for field operations.

The GeoTIFF file is large (~1 GB) and can be drag-and-dropped into GIS software (e.g. QGIS or ArcGIS) for further analysis in support of decision-making efforts.


  • HDP Nexus 5W Map - snapshot of agencies’ activities in intense earthquake townships

Please let us know if you have any questions or additional information that we should include. Thank you for your continued support in these trying times.
 

Explore recent and historical earthquake activity in Myanmar and surrounding areas with this interactive dashboard. Using available data since April 2007, this aims to provide insights into earthquake frequencies, magnitudes, and trends within the region. Features include:

  • Interactive Map: See the location and magnitude of individual earthquakes, color-coded for magnitude.
  • Time Period Selection: Use the slider to focus on specific date ranges (since April 2007 to today).
  • Magnitude Breakdown: Analyse the distribution of earthquakes by magnitude for your selected period.
  • Historical Trends: View earthquake frequency month-by-month and year-by-year since April 2007.
  • Data Filtering: Click on magnitude ranges or specific months/years in the charts to refine the displayed data.
  • Summary Statistics: Get quick counts of total events and significant earthquakes (Magnitude 5.0+) within the selected period.

This dashboard will be updated regularly based on data from the Thai Meteorological Department (TMD) and the United States Geological Survey (USGS). TMD data includes more localised earthquakes but less accurate and has discrepancies compared to USGS data.

Based on contributed data from HDP Nexus 5W partners, we have released a new map showing a snapshot of activities prior to the earthquake in townships that experienced an intensity of 6 or above on the Modified Mercalli Intensity Scale. A total of 111 organisations are reported to be working in these townships. Explore the map for more details.

You may also download the list of these townships. (Download here)

The United Nations Satellite Centre (UNOSAT) has released its initial assessment of structures potentially damaged by the recent Sagaing Earthquake. Using very high-resolution Pleiades satellite imagery, UNOSAT analysed areas in the Sagaing and Mandalay Regions. Here is a brief summary of the results released so far:

  • Within 52 Towns/Village Tracts (~340 km²) covering parts of Sagaing and Mandalay, UNOSAT identified 1,095 damaged structures and 1,325 potentially damaged structures.
  • Within a specific ~30 km² area analysed in Sagaing Township, UNOSAT identified 233 damaged structures and 557 potentially damaged structures.
  • Within an analysed area of ~60 km² covering Mahaaungmyay, Chanmyathazi, and Chanayethazan Townships, UNOSAT identified 509 damaged structures and 284 potentially damaged structures.

Please Note: This is a preliminary analysis based on satellite imagery and has not yet been validated in the field. UNOSAT welcomes ground feedback to refine the assessment.

Kyle Bradley and Judith A. Hubbard shared their analysis of the rupture in the latest article on Earthquake Insights.

The updated USGS slip model shows an interesting pattern along the fault rupture. The southern section of the Myanmar fault seems to have slipped only in the upper several kilometers, for a length of over 100 kilometers. This is a bit unexpected, because larger slip usually happens on the deeper part of the fault, and smaller slip happens close to the surface.

One hypothesis is that earthquakes in 1929 and 1930 might have ruptured the deeper parts of this southern fault segment, leaving the shallow section stressed but locked. The powerful M7.7 event, tearing southwards, may have finally “unzipped” this shallow, waiting portion.

Important Note: These slip models, yet powerful, rely on interpretations based on available data (which is sparser for Myanmar than for some other recent major quakes). Different analyses might show variations.

  • Maps from the latest HDP Nexus 5W Round (February 2025): Released today, these maps offer a very recent snapshot of humanitarian, development, and peace activities on the ground before the earthquake, providing a pre-disaster baseline.
  • MIMU has compiled the list of 91 townships that experienced earthquake intensity 6.0 and above, based on USGS’s Modified Mercalli Intensity (MMI) data. (Download here)

Please let us know if you have any questions or additional information that we should include. Thank you for your continued collaboration in these trying times.

One year ago, we produced a map showing the epicentres of earthquakes in Myanmar over the last 100 years (data as of December 2023). An updated version is now available, including the latest seismic activity data as of February 2025.

These resources can be explored in the MIMU’s dedicates page for earthquake emergency preparedness and response.

Explore the trends in food and commodity prices, as well as market conditions in Rakhine State, Shan State, Kayin State, Magway, and Sagaing Regions, in the latest reports released today on the Market Analysis Unit (MAU) page.

The Market Analysis Unit is an independent project that provides donors, humanitarian responders, development practitioners and private sector actors in Myanmar with data and analysis to better understand the impacts of market developments, conflict and other crises on household purchasing power, supply chains, financial services, and labour markets.