News

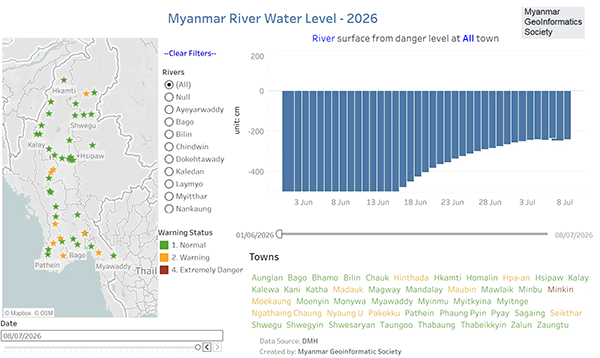
With the monsoon now well underway and heavy rains reported across parts of the country, effective monitoring of water levels, whether for rivers or man-made water retention structures such as dams, is important for flood preparedness and response.

Two resources hosted on the MIMU website, courtesy of Myanmar Geoinformatics Society, may be useful during this period:

  • River Water Level Dashboard provides daily updates on water levels and warning statuses for major rivers, measured at various towns along the riverbanks.
  • Dam Water Level Dashboard complements the river dashboard and monitors the current status and short-term trends of water levels across dams countrywide.

📝 Explore both dashboards on the MIMU website.
 

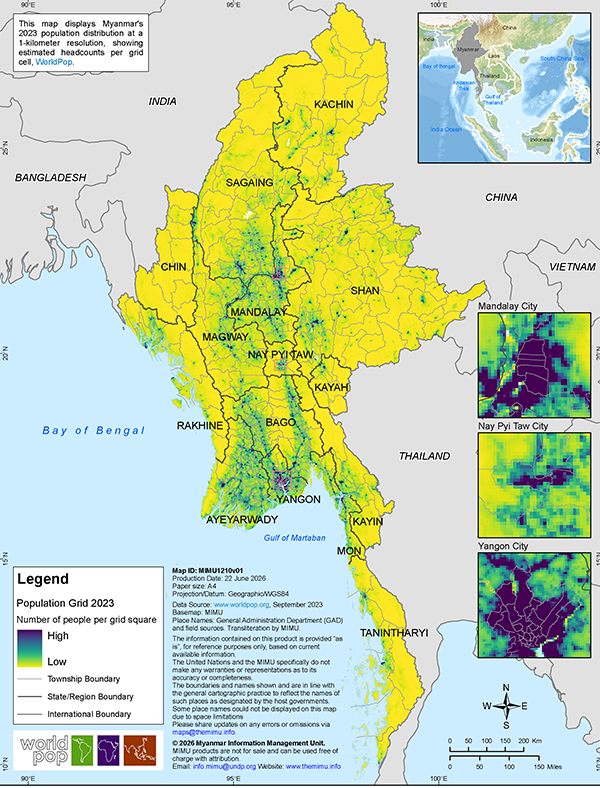
Latest map from MIMU depicts the estimated distribution of Myanmar’s population as of 2023, offering humanitarian and development actors a detailed, grid-based view of where people live across the country.

Drawing on WorldPop data, rather than reporting figures by admin levels such as townships, the gridded approach shades each cell from low to high density, allowing users to see settlement patterns at a finer resolution than administrative boundaries alone would permit. To bring out detail in the largest urban areas, the map includes three zoomed insets covering Mandalay City, Nay Pyi Taw and Yangon City.

Download the map from MIMU website.

Access a dedicated hub for humanitarian practitioners, policy-makers, and field workers. Explore IEC, guidelines, foundational training resources, and operational checklists designed to ensure that persons with disabilities are meaningfully included, protected, and empowered in every humanitarian response.

The hub brings together a comprehensive set of resources, including foundational training across seven modules covering the IASC Guidelines, the Must-Do Actions and Twin-Track Approach, Inclusive Project Cycle Management, and accountability to affected populations. You’ll also find operational checklists for the built environment, guidance on mainstreaming disability inclusion, disability-inclusive indicators, inclusive data collection, and thematic resources on understanding disability, communication and attitudinal barriers, and inclusive disaster risk reduction. Many of these tools are available in Myanmar, Kachin, Mon, Pwo Kayin, Sagaw Kayin, and Shan.

Visit the hub on MIMU website.


(A sample from the collection of resources available on the hub)
 

A picture tells a thousand words. Mine Free Myanmar is looking for powerful imagery that captures the impact of landmines on the people of Myanmar, and their adaptation to life-disrupting injury.

Submission guidelines

  • Informed consent essential.
  • The photograph must clearly show a survivor with a landmine injury undertaking daily activities in their home, farm, or community.
  • You may tell the story through a single photo or a series of photos.
  • Photos must be active, not passive.
  • One descriptive paragraph may be attached to the photo.

Send your entry to [email protected] by 31 July 2026. For more info, please visit Mine Free Myanmar’s facebook page.
 

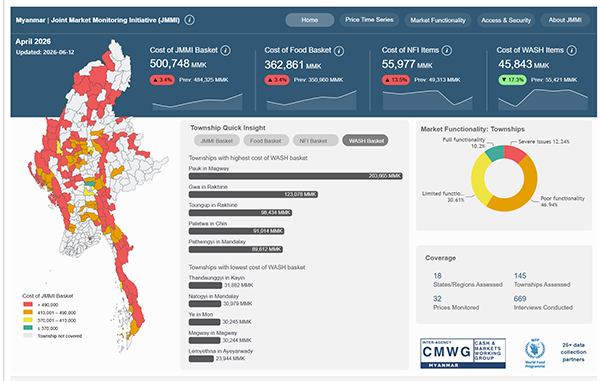
Two regularly updated resources can support partners’ operational decision-making with regards to food and market situation in Myanmar. The Joint Market Monitoring Initiative (JMMI) tracks market functionality and price dynamics through monthly data collection using harmonised tools. Its interactive dashboard presents township-level prices for food, NFI, and WASH items, alongside Market Functionality Scores and access and security conditions. The April 2026 round covers 145 townships based on 669 vendor interviews, drawing on over 25 data collection partners coordinated through the Cash and Markets Working Group (CMWG), supplemented by WFP price monitoring data. 

Explore the dashboard here.

For deeper analysis of these dynamics, IFPRI’s Monthly Food Price Report can also be a useful resource. The April 2026 edition highlights a sharp rise in rice prices (up 8.9 per cent month-on-month), continued year-on-year increases in animal-sourced foods, and emerging fuel and fertiliser supply risks. 

Read the full report here. 

We’re still welcoming submissions from focal persons across your organisations, and there’s now additional time to share records of your recently completed, ongoing, and planned assessments and publications. 

This exercise helps organisations like yours across Myanmar’s humanitarian and development community gain a clearer picture of information-gathering initiatives underway, and to exchange plans, results, methodologies, data, and expertise. It’s also a chance to share your publications more widely through the MIMU website.

For more details, please review the guidebook which includes detailed steps on preparing your data entry. If you need any help, you feel free to reach out to us.

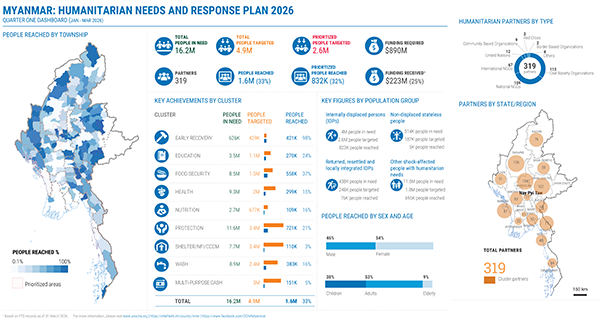
As of 31 March 2026, humanitarian partners reached 1.6 million people across Myanmar, one-third (33 per cent) of the 4.9 million targeted under the 2026 Humanitarian Needs and Response Plan; a strong start to the year despite the plan being only 25% funded. 

Explore the infographic / dashboard showing the breakdown across clusters, townships, and population groups.

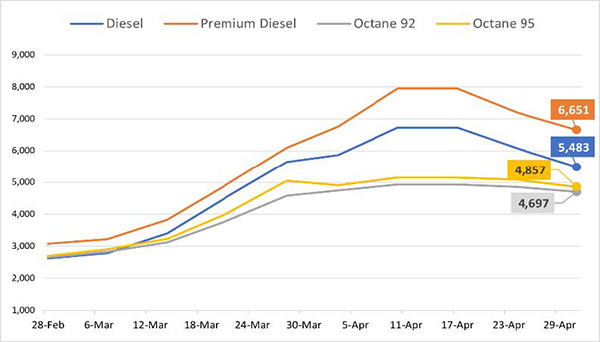
If you missed it earlier this month, the WFP Myanmar Country Office released a brief tracing how the Middle East crisis is reaching Myanmar's markets, drawing on weekly fuel and food price monitoring in 26 townships across 10 states/regions.

As of the reporting period (week of 6 May), diesel prices were sitting around 100% above end-February levels nationwide, with parallel-market Octane 95 in Sittwe roughly 13 times pre-crisis Yangon prices. The food basket had risen 18% over the same period, driven by rice, palm oil, chickpeas, and salt. Fertilizer supply risks were arriving just as farmers move into the main rice planting season.

Explore the full brief (with other reports on Myanmar) on WFP website.

Complementing the dashboards, maps, and summary datasets already released for this round, our new analysis offers an overview to support planning, coordination, and resource allocation across Myanmar, covering activity concentration, organisational presence, and sector-specific patterns.

Explore the interactive visualisation or download the static infographic.


We’ve also produced a dedicated analysis of activities reported as related to the March 2025 earthquake, one year on from the event.

Explore the interactive visualisation or download the static infographic.

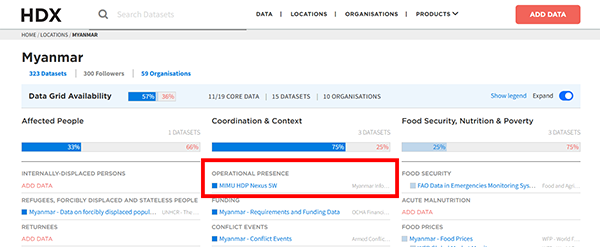
Latest summary datasets from the February 2026 round of HDP Nexus 5W are now available on MIMU and HDX (contributing to Myanmar’s Data Grid). These cover voluntarily contributed data from 219 organisations across all states and regions of Myanmar, as of 28th February 2026.

Three downloadable datasets include:

  • Sector / Sub-Sector summary: the overview across all 23 sectors with sub-sector detail, showing count of reporting organisations, township coverage, and activity counts at each project status.
  • Location × Sector × OrgType summary: overview by State/Region (Adm1) and township (Adm3) against 9 organisation types and 23 sectors, designed for operational planning at any geography.
  • Earthquake summary: a focused view of activities flagged as 2025 earthquake response, with sub-sector and organisation-type breakdowns, down to township level.

These datasets are built to be explored and used. Whether you are coordinating partners or writing proposals, you can:

  • Benchmark your sector’s geographic footprint against others in the same state /region.
  • Overlay the township-level breakdowns with population, PIN, or severity data to build a custom view of where reporting and need overlap.
  • Reference the breakdowns in the context section of a proposal, briefing, or sit-rep.
  • Using the summary data from last few rounds, do a trend analysis.

Together with the maps and dashboards, these summary datasets are designed to support your work. Download the datasets now on MIMU and HDX. 📊