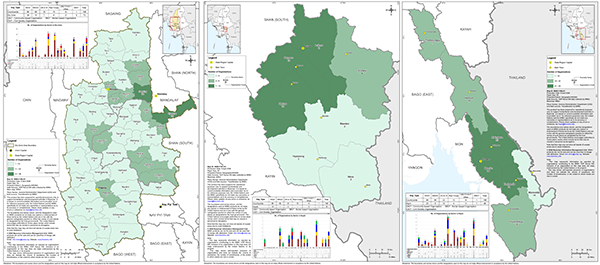
Updated static maps have also been released for the February 2026 HDP Nexus 5W round, with one map per state/region + for specific areas such as Dry Zone, and Southeastern Myanmar. Alongside township-level organisation counts, each shows breakdowns by sector and organisation type. You can explore the full set on the MIMU website.
News
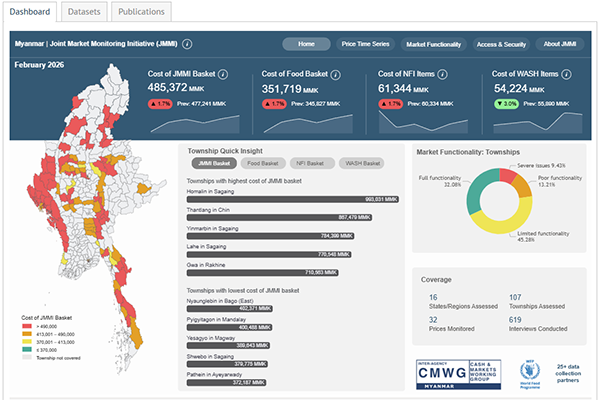
What does a basic basket of goods cost in your area of operation? Which townships are facing the most severe market disruptions? For answers to these questions and more, explore the new Joint Market Monitoring Initiative (JMMI) interactive dashboard, now available on the MIMU website.
The dashboard gives partners a powerful way to explore market conditions and support operational decision-making. Users can filter by township or state/region, track commodity and basket prices over time, examine market functionality scores, and understand access and security conditions.
The JMMI is coordinated through the Cash and Markets Working Group (CMWG) and is designed on the basis of collaboration, with over 25 data collection partners and supplementary WFP price monitoring data. JMMI resources are all available on the MIMU website. If you are interested in learning more or contributing to the initiative, please reach out to the CMWG via [email protected].
Are you a creative individual who cares about the impact of landmines on your community? Mine Free Myanmar is inviting everyone to take part in their 4th Nationwide Art Contest on the theme “The Impact of antipersonnel landmines on my community”. Artwork can be in any medium, static art, computer graphics, video, music or any other format, and in any language used in Myanmar. Entries are welcome across Adult and Youth (over 17) categories. Submissions open 4 April 2026, International Mine Action Day, and close 21 September 2026, International Peace Day. Send your work to [email protected] or visit the facebook page for details.
The latest MIMU village-level state/region maps, updated in accordance with Pcode version 9.7, are now available on the GIS resources page of the MIMU website.
On 28 March 2025, the 7.7Mw earthquake, Myanmar’s most powerful in recent history, caused widespread destruction across the country. Twelve months later, affected communities are still navigating the long road to recovery, and the demand for reliable, coordinated information to guide response efforts has not diminished.
In the hours following the earthquake, MIMU launched a dedicated emergency page to serve as a resource hub for the humanitarian and development community. That page has since grown into a substantial repository hosting….
- 200+ reports, assessments, and appeals from partners
- 60+ maps including MIMU-produced maps on earthquake impact on roads and bridges, and probable building damage, alongside UNOSAT satellite assessments of damage to UNESCO heritage sites such as Bagan and Pyu Ancient Cities
- Technical guidelines, RCCE materials, mental health and psychosocial support resources, and many more
As partners work alongside affected communities, from restoring agricultural livelihoods to rebuilding infrastructure, data and evidence remain at the heart of an effective response. The latest MIMU HDP Nexus 5W (August 2025 round) offers earthquake-specific insights, showing 74 organisations reporting earthquake-related activities across 81 townships in 8 states and regions.
MIMU's Interactive Earthquake Monitoring Dashboard tracks over 3,300 seismic events in Myanmar and vicinity since April 2007 using Thai Meteorological Department and USGS data, providing ongoing situational awareness.
With continued recovery efforts in the period ahead, we encourage all partners to explore and contribute to these resources as the response transitions from emergency to longer-term recovery.

A study published in PLOS Climate (February 2026) has produced climate simulations for Myanmar at 5 km resolution: a significant step up from the 25-60 km used in previous studies.
Using the WRF model under moderate (SSP2-4.5) and high-emission (SSP5-8.5) scenarios, the study shows annual warming of 0.9 to 2.7°C through end of century, with the Dry Zone heating disproportionately with up to 3.6°C in April under the worst case.
Rainfall changes are uneven: the Shan Hills and Tanintharyi Region face significant drying (10-20%), while the Dry Zone and northwest could see 40-60% more rainfall by end of century under high emission scenario. January, July, August and November are projected to become drier, while June, September and October are expected to get wetter.
The study also flags a health risk: combined peak warming and increased rainfall in June could push wet-bulb temperatures into dangerous territory.
Full paper: https://doi.org/10.1371/journal.pclm.0000820
MIMU is one of only 16 organisations contributing to the HDX Data Grids, which assess the availability of foundational data across 22 humanitarian operations worldwide.
Myanmar’s Data Grid shows 63% of data available and up-to-date, with 37% currently unavailable, partly reflecting data sensitivity and access constraints unique to the Myanmar context.
MIMU’s contributions include regularly updated datasets on operational presence (through the HDP Nexus 5W), administrative boundaries (Pcodes), and other baseline data that support coordination and decision-making for humanitarian and development organisations in Myanmar.
The report also highlights that unprecedented funding cuts across the sector led to a global decline in data availability, from 74% to 68% year-on-year, with further reductions expected in 2026 as organisations adapt to smaller budgets and reduced capacity.
Read the full report (Direct Download).
Explore MIMU's HDX page.
The report was released in Dec 2025 first in English with the Myanmar version launched last week on 26 Feb 2026. Both versions are now available on Mine Free Myanmar website.
Highlights from the report include:
- 2,029 mine/explosive remnants of war (ERW) casualties were reported in Myanmar in 2024, the highest globally for the second consecutive year, up from 1,003 in 2023. 86% of all casualties were civilians.
- Cumulative recorded casualties since 1999 now total 9,206.
- Suspected contamination has been reported in 211 of 330 townships across all states and regions as of October 2025, up from 100 in 2020.
The report also references MIMU’s landmine/ERW contamination map and infographic which has been produced annually since 2009 in collaboration with International Campaign to Ban Landmines (ICBL). Also released alongside the report is Mine Free Myanmar’s "From Silence to Expression", (Download here) documenting three years of their nationwide art competition on the impact of landmines.
Some of Myanmar's hardest-to-reach villages are being mapped through MIMU's Pcodes initiative, started in 2007, to support humanitarian and development activities across the country. The database now includes 66,659 villages, with 81.9% mapped, and work continues to map the remaining 12,000+ villages, mostly in Kachin and Shan States.
Explore the latest changes in Pcodes v9.7 to see which villages have updated coordinates and which ones have gained coverage for the first time, in our newly released interactive explorer.
Last week, we launched the refreshed MIMU Bulletin to help you navigate the wide range of resources MIMU has built up since 2007. Whether you’re a new or longtime user, the tool asks a few simple questions about what you’re looking for and points you to the right products in seconds. You might even discover related resources you didn’t know existed.
🚩 Explore the MIMU Bulletin here.
- ‹ previous
- 3 of 22
- next ›