
For this round, 10 organizations have provided 40 new Assessments/Publications as of 19 November 2025, bringing the total to 2,673 records from 205 organizations. These are available through the MIMU Assessments & Publications Tracking Webpage.
The updated MIMU Assessment Tracking Overview Dashboard can be seen through the link: https://themimu.info/assessment-dashboard.
Thanks to all agencies for your active participation in this exercise.
You are more than welcome to provide updated info of your planned and ongoing assessment at any time online through the submission page (You will need an account and if do not have one, please contact us). Please consult the guideline if you need any assistance or feel free to reach out to us.
News
The recently launched 2026 Myanmar Humanitarian Needs and Response Plan identifies critical priorities to address Myanmar's deepening humanitarian crisis.
Key highlights include
- 16.2 million people in need
- 4.9 million people targeted for humanitarian assistance
- US$890 million required to address critical needs
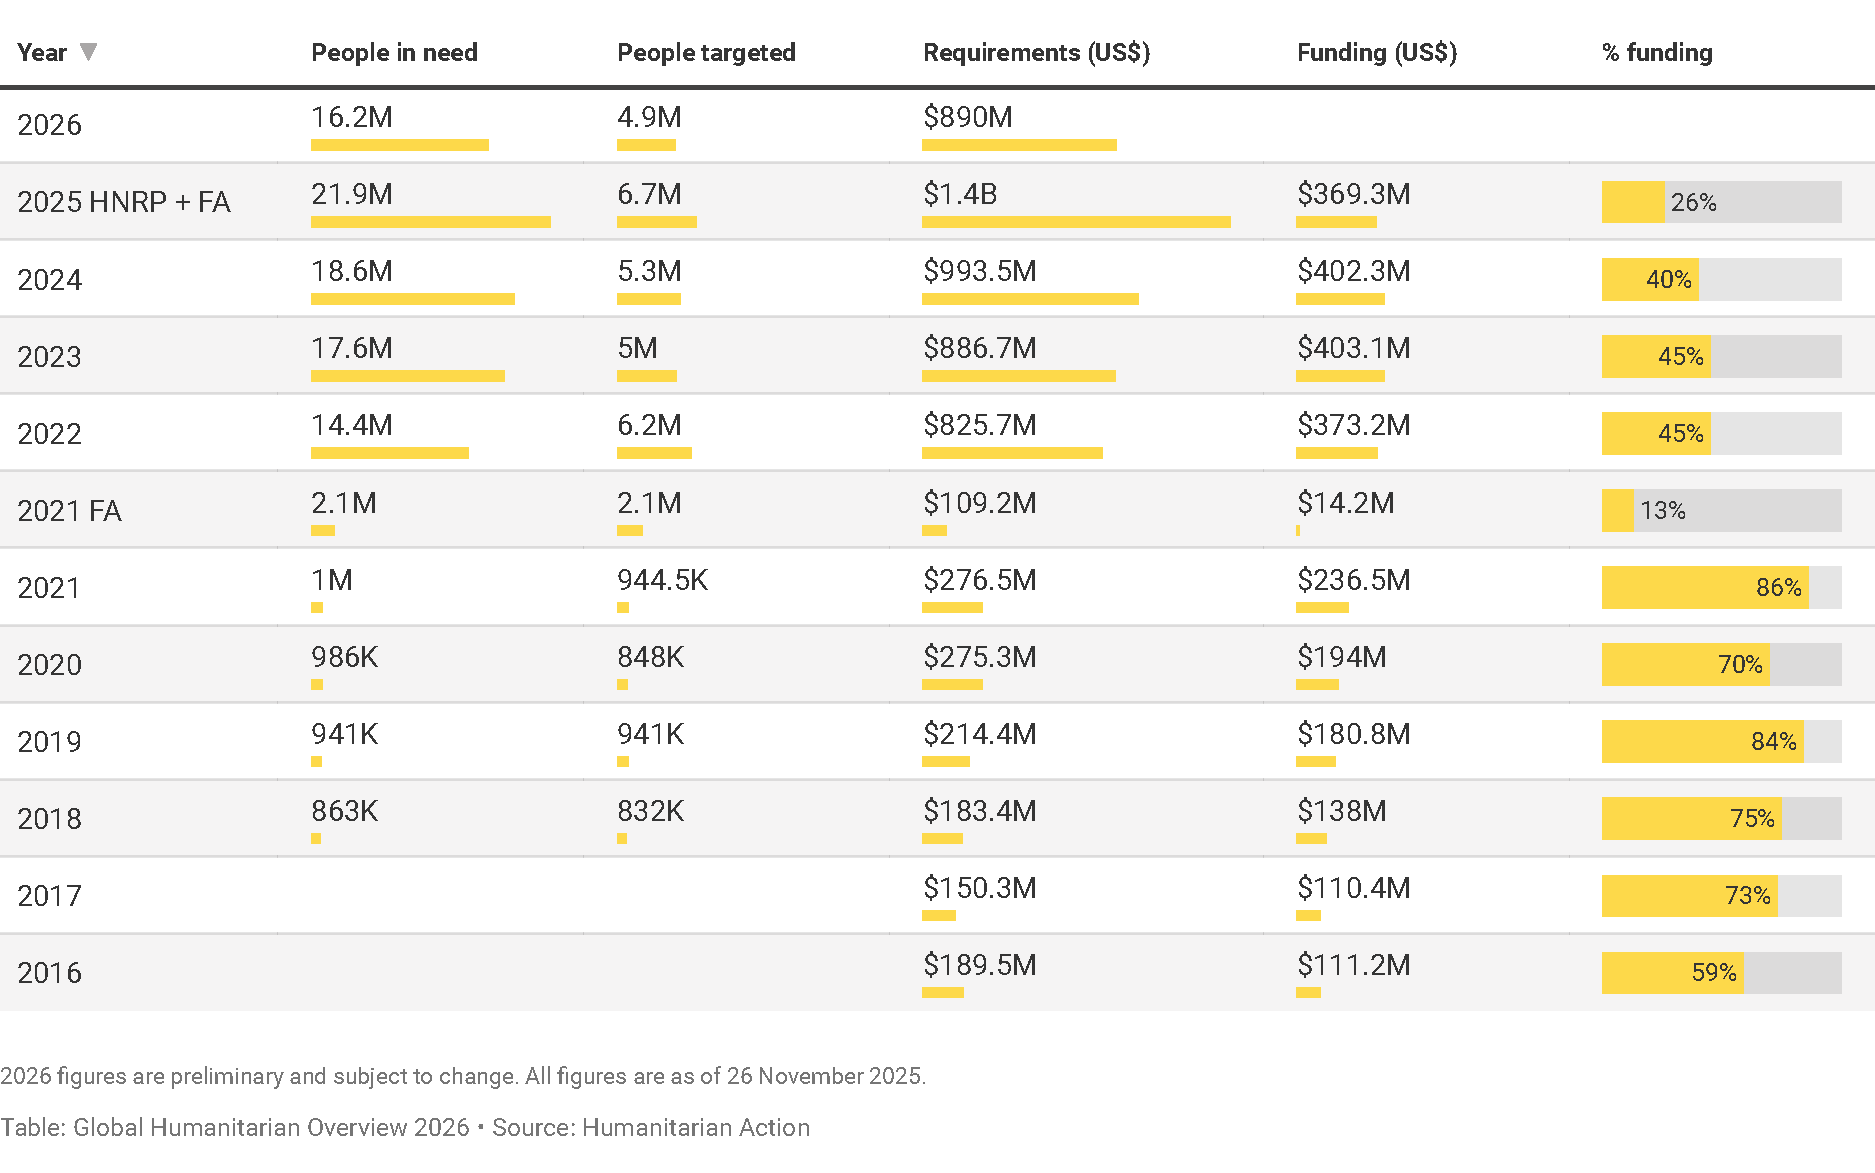
Cluster Strategy Related to HNRP
Economic conditions in Myanmar remain severely constrained, shaped by the lingering impacts of the March 2025 earthquake, ongoing conflict, subdued domestic demand, labor shortages, and persistent power outages. The recovery is fragile and uneven, with businesses and households continuing to face significant challenges.
Review the latest Myanmar economic monitor report from the World Bank. The report, titled “Myanmar Economic Monitor : Surviving, Not Thriving - Special focus on Myanmar’s Agrifood Industry Resilience and Adaptability”.
Only 45% of earthquake-affected firms have returned to pre-earthquake activity levels, with manufacturing and agriculture facing the slowest recovery due to physical damage, high reconstruction costs, and limited access to finance.
Household impact: The MSPS surveys show the earthquake affected 16% of households nationwide and nearly 60% near Mandalay, Sagaing, and Naypyitaw. Consumption fell by 2%, and poverty rose sharply.
Repairs & livelihoods: Only half of affected households have begun repairs. Loss of homes, assets, and jobs has deepened vulnerability; informal work has increased in urban areas.
Looking ahead: A 3% rebound is projected in FY2026/27, driven by reconstruction and targeted support, but financing shortfalls, labor shortages, weak demand, and structural constraints may slow recovery.

Myanmar’s opium poppy cultivation has risen 17% to 53,100 hectares, with the largest increases in East Shan (32%) and Chin State (26%). South Shan remains the heaviest cultivation area, while Sagaing Region is included for the first time.
Review the latest opium survey report from the United Nations Office on Drugs and Crime (UNODC). The report, titled “Myanmar Opium Survey 2025: Cultivation, Production and Implications”, analyses data collected in Myanmar during the fourth growing season since 2021.
The findings reflect the uncertainty the country faces after years of conflict and socio-economic instability. It also underscores that Myanmar has become the world’s main known source of illicit opium as cultivation continues to decline in Afghanistan.

Did you know that there were around 4.8 million women and girls living in the hardest-hit areas of the Mar 2025 earthquake, including about 2.8 million in Mandalay Region alone?
We have started our contribution to the 16 Days campaign through daily social media posts based on facts and figures on the challenging situation of women and girls in Myanmar. Be sure to follow us on LinkedIn and Viber for these and other updates.
Alongside these posts, we are sharing a new thematic infographic that brings these key figures together in one place and highlights some of the main patterns we see in the data.
This year’s thematic infographic draws from various local and international publications, as well as our own HDP Nexus 5W and Assessment/Publication tracking data, with available data as of Nov 2025.
We hope this brings much-needed attention to the situation of women and girls in Myanmar, not only as an informational resource but also for advocacy. To that end, you are more than welcome to share it with your colleagues and networks.
The infographic can be downloaded from the Gender page of the MIMU website.

The infographics that we released last week on
- Townships with known landmine contamination and casualties in Myanmar
- Changes in contaminated townships and annual casualties since 2021
are now available in Myanmar language.
Explore on the Mine Action page of the MIMU website..

Did you know there are 211 townships in Myanmar with suspected landmine/ERW (Explosive Remnants of War) contamination recorded between 1999 and 2025, up from just 48 townships in the 1999 - 2020 period?
The annual map and infographic of townships with known landmine contamination and casualties in Myanmar have been updated. These were created in collaboration with the International Campaign to Ban Landmines (ICBL). They cover information such as the geographical distribution of reported casualties, types of explosive devices, and reported activities at the time of injury for the 2007 - 2024 period.
For the first time, an interactive infographic (along with a downloadable version) has been created to visualise changes in contaminated townships and annual casualty data, illustrating trends since 2021.

The latest report from the Market Analysis Unit (MAU) is the Market Price Report (MPR) for September 2025, covering data from 37 townships across 9 states/regions in Myanmar. Data are collected from three vendors per product per market at the end of each month. For this round, prices were collected one week later than usual, in the first week of October.

The Market Analysis Unit is an independent project that provides donors, humanitarian responders, development practitioners and private sector actors in Myanmar with data and analysis to better understand the impacts of market developments, conflict and other crises on household purchasing power, supply chains, financial services, and labour markets.
In September, delivery of assistance to an estimated 130,000 people was affected due to 108 access-related incidents reported across 13 states and regions. This marks a 22 per cent increase compared to August and remains above the monthly average for 2025. Rakhine had the highest number of reported incidents for the third consecutive month, followed by Southern Shan and Sagaing.
Overall, humanitarian operations continued to face challenges due to ongoing hostilities in 11 states and regions. Kachin, Rakhine, Sagaing, Eastern Bago, Kayah and Kayin collectively accounted for 65 percent of all reported incidents.
Explore the infographic.

Supporting the comprehensive dashboards, maps, and summary datasets previously released, this targeted analysis offers insights and overview that support planning, coordination, and resource allocation decisions across Myanmar.
Here are some of the insights.
- Activity concentration: 56.6% of ongoing activity records come from 20% of townships (337 townships with ongoing records, median 205 per township).
- Organisational spread: The top 10% of organisations account for 80% of ongoing activity records.
- Organisational Presence: Median 7 active organisations per township. Nyaungshwe in Shan (South) has the most at 42.
- Sectors: Agriculture has the most ongoing activity records, followed by Health and Protection.
- Active organisational presence pattern can partially be explained by Population, and People-in-Need.
Explore the interactive visualisation or download the static infographic.

In response to March 28, 2025 earthquake, this round included a specific question on whether the activities are related to earthquake. Early Recovery Cluster was also added to the Sector/Cluster list.
Here are some of the highlights.
- Share of activity records: 5.51% are earthquake-related; 64.6% of these are under implementation.
- Sectors: WASH reports the most earthquake-related activity records, followed by Food and Protection. Early Recovery Cluster activity records are around 5.5%.
- Organisations: 74 organisations report earthquake-related activities (36 INGOs, 17 NNGOs, 10 UN, and others). Food, Protection, and WASH Clusters/Sectors have the most reporting orgs.
- Where: 81 townships across 8 states/regions report earthquake-related activities. Mandalay Region has the most organisations active on earthquake response.
- Prioritised townships: 70 organisations report from 58 OCHA-prioritised townships.
Explore the interactive visualisation or download the static infographic.

- ‹ previous
- 5 of 22
- next ›