MIMU Basic Tableau Training Resources
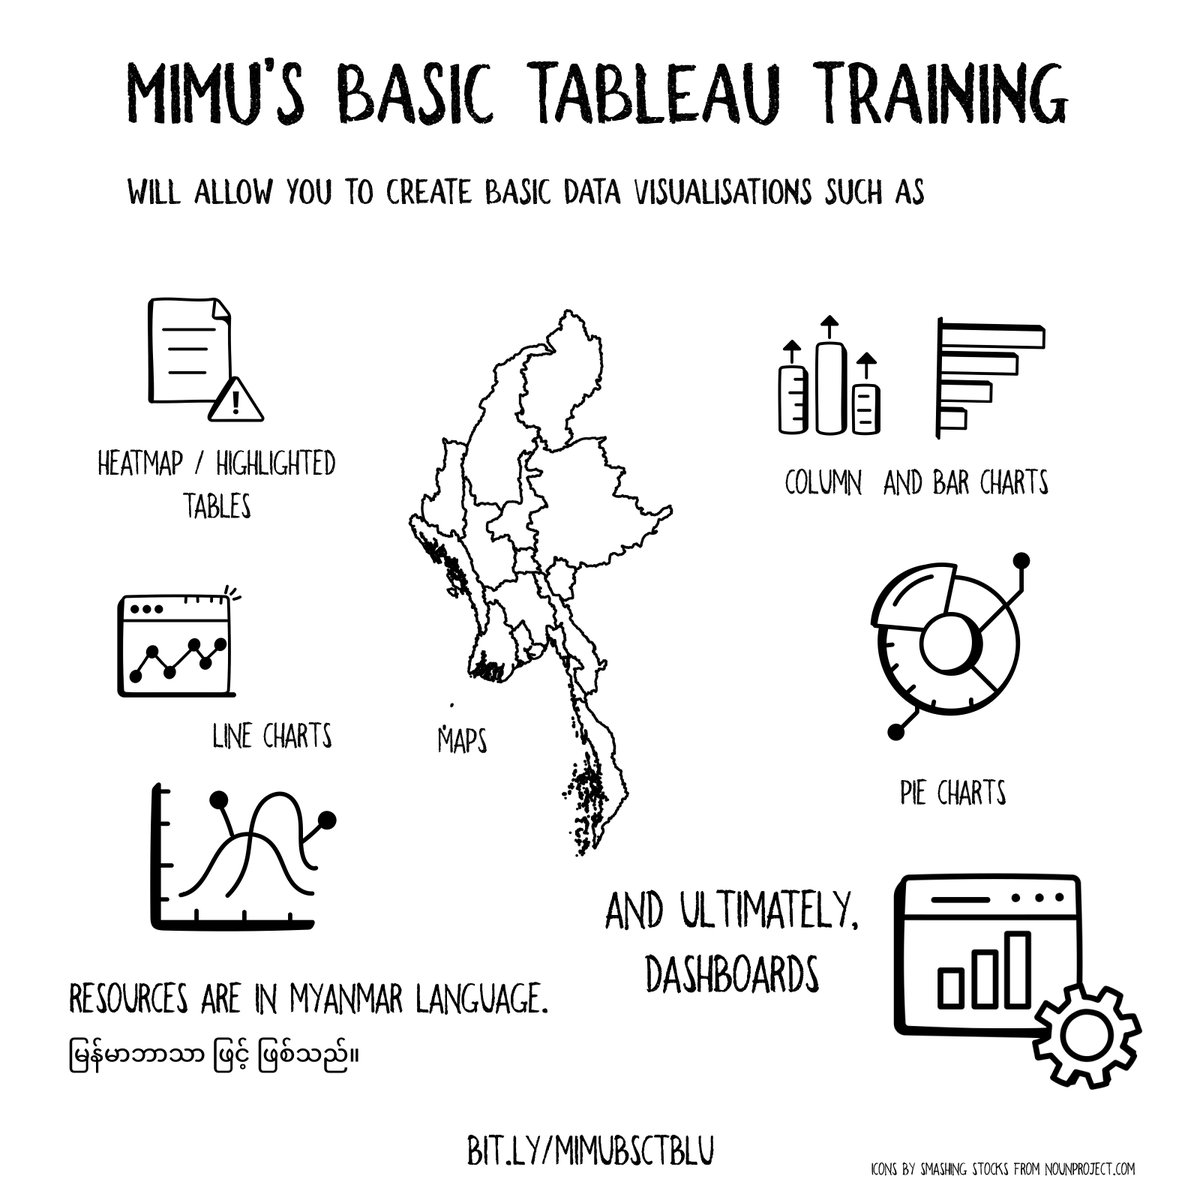
Welcome to MIMU Basic Tableau Training. This course will serve as a beginner-oriented introductory course on using Tableau software (specifically, Desktop Version 2021.4). As one of the most powerful and fastest data visualization software, Tableau allows users to easily perform tasks such as comparing, sorting, analysing and sharing information and insights. This course covers basic topics such as preparing data for use in the software, creating a map at different administrative levels, drawing charts/heat maps/highlighted tables, developing a dashboard with search functionality and hyperlinks, and updating/changing data sources.
On this page you will find course materials – videos, handouts and exercises - developed by MIMU for our Basic Tableau Training. We would like to thank Tableau for their generous contribution over the period November 2019 to November 2023 which has allowed MIMU to develop our own skills and to share this knowledge with others working in humanitarian, development and peace-related sectors. Your feedback on how you find the course and especially on how they have helped your work will greatly help us to improve our courses. the MIMU Training Feedback Form.
Introduction
Training Resources
Manual
Data Sources - Excel files
Data Sources - Spatial files
Data Sources - Text files
Mapping
Heat Map table/Highlighted table
Charts
- 01_Bar Chart - Video File (Jan 2022)
- 02_Column Chart - Video File (Jan 2022)
- 03_Line Chart - Video File (Jan 2022)
- 04_Pie Chart - Video File (Jan 2022)
- 05_Labelling Both Data Value and Percentage - Video File (Jan 2022)
- 06_Area Chart - Video File (Jan 2022)
- 07_XY (Scatter) Chart - Video File (Jan 2022)
Creating a Dashboard
- 01_Creating Dashboard - Video File (Jan 2022)
- 02_Text Boxes in Dashboard - Video File (Jan 2022)
- 03_Arranging Sheets in Dashboard - Video File (Jan 2022)
- 04_Inserting Search in Dashboard - Video File (Jan 2022)
- 05_Inserting Download in PDF function - Video File (Jan 2022)
- 06_Inserting weblinks in Dashboard - Video File (Jan 2022)
- 07_Uploading Dashboard on Tableau Server - Video File (Jan 2022)
Updating/Changing Data Source of a Dashboard